


Earlier in June, we released the report compiling ridership figures for all City Direct and peak express bus services for the month of April 2026. Besides our own socials platforms, we also posted it to Reddit for the wider Singapore community to look at too, and by now the many of you who have come across the report (or any of its condensed infographics) would have come up with your own conclusions surrounding the data.
Some have asked why the report did not come with a conclusion of the data, and my response to them was that there was a great diversity in thought among people interested in transit, so much so that every reader of the full report is likely to have a different interpretation of what the numbers mean for the long-term viability of the peak expresses that the BCEP banks heavily upon. Nonetheless, on request, this post shall carry my own interpretation of the statistics presented in the April ridership report.
Cut losses
“Insanity is doing the same thing over and over again and expecting a different result.”
-Unknown, commonly misattributed to Albert Einstein
We need to talk about all the new destinations added to the City Direct catchment area since the launch of the BCEP. Yes, it’s a positive attempt towards diversifying the potential rider base of the City Directs, and we did encourage this direction in the past too. But looking at the results paints a completely different story, especially when one recalls that as of when this data was collected, it had been 18 months since these new routings were introduced. We like to laugh at the four routes serving bus stops in the Novena and Newton areas as being the product of abject misguided planning, but doing so misses the far more egregious offender. The elephant in the room when it comes to BCEP CDS planning, if you would call it.
Starting with 673 (the first BCEP CDS introduced), almost every new CDS introduced includes a sector in Suntec City. Hell, two legacy CDS routes (671, 672) were also extended to serve Suntec City as well! Home to four office towers, a massive mall decked underneath and a convention center, it appears to be a logical area to route these City Directs to increase ridership, right? The numbers tell you a resounding no, and it’s not even close. Despite being stacked with numerous peak express routes from all over the country (well, mostly from the northeast in the name of alleviating NEL overcrowding), total ridership to Suntec City across the entire month of April stands at a measly 3559 passengers.
That translates to just 179 people per day, or barely enough to fully seat two double-decker buses with room left for spare. How many CDS trips serve Suntec City in the morning in total? 25 across 8 bus services. For crying out loud, the “useless” Novena route segments manage 106 people per day (more than half of the Suntec total) served by only five routes in the study.
In other words, almost every CDS bus heading to Suntec City is nearly empty! If this had happened in another country there’d probably be a more colourful term used to describe such planning behaviour, which is a phrase synonymous with washing cash.
You know, it’s quite a feat to spam so many routes to one area, only for their combined ridership to barely edge out other areas around the central area niche to only one or two routes included in the study? Now, while the results are meme-worthy to poke fun at the terrible planning logic going on behind closed doors and with heavy political intervention, I don’t think this reflects a failure of the idea of expanding CDS catchment beyond the immediate white-collar areas downtown, but rather a case of horrible execution despite presumably the best intent.
This is not a tour bus!
这你tm不是观光车,不run许拍照!
As far back as December 2024 when the first CDS “enhancements” were introduced under the BCEP I made the bold prediction that the Suntec extensions of 666, 671 and 672 would invariably fall flat and become as useful as a white elephant, due to the extreme detour taken just to get to Suntec City. Though there’s been mostly anecdotal confirmation of that prediction, the report unfortunately proved my prediction extremely right using the numbers, even more so than I wanted it to be.
Mostly as an extension of the previous point on the absurdity of sending everything under the sun to Suntec City, but here are the numbers for ridership of various CDS routes that do serve the Suntec area, alongside others. To say the least these results are shocking. Here’s the data for CDS 671 and 672 (legacy CDS extended under BCEP) and 673 and 677 (newly introduced under the BCEP). Just note how consistent the lack of ridership there is, regardless of the route’s age, showing this is entirely not an issue of commuter familiarity — the route design is the sole reason for the lackluster outcomes shown.
You may read the intro to the heatmaps to learn more about how bus ridership data on our STC-BRDV is organised in the full data sheets linked here, before proceeding with the screenshots below. But in short, columns from left to right denote boarding bus stops, while rows from top to bottom denote alighting bus stops. The black outlined box indicates ridership through the express sector, with data points outside the box excluded from the study altogether.
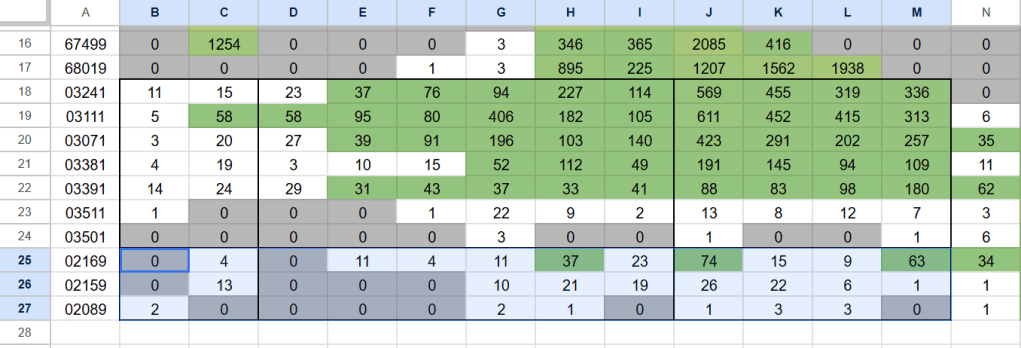
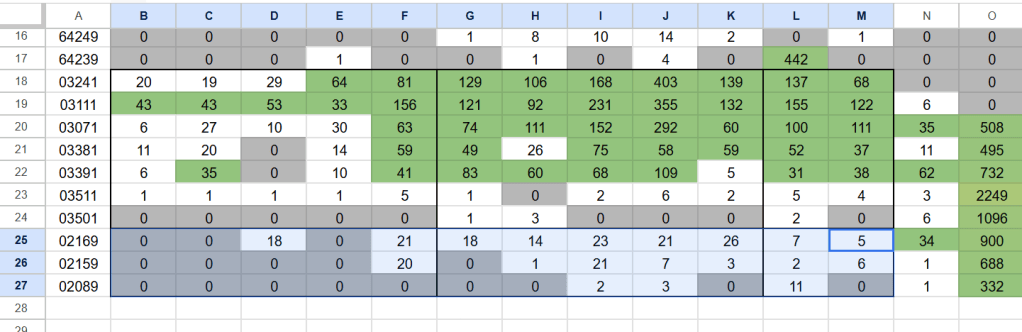
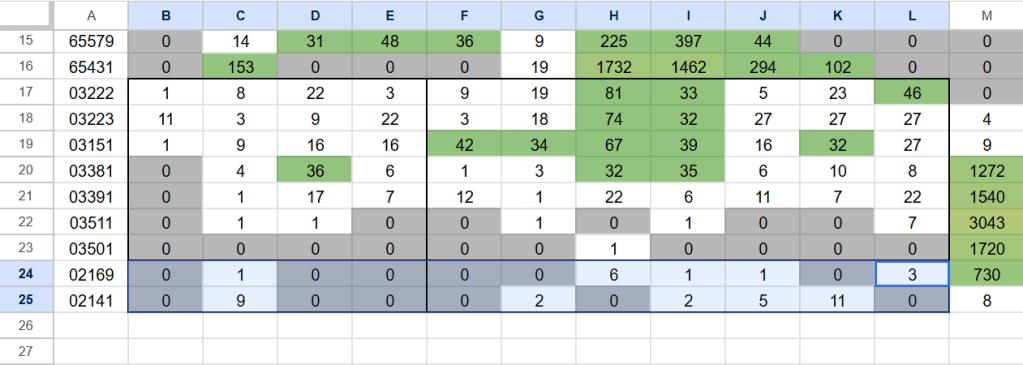
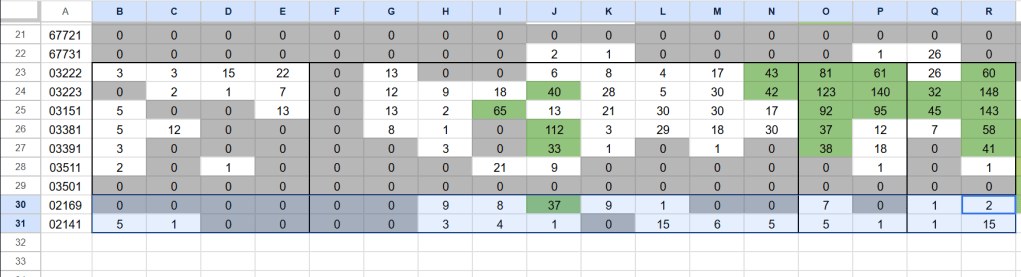
Because who the heck wants to ride a bus from Punggol all the way down to the southern end of Singapore, and then spend another 20 minutes backtracking up to Suntec City, when they could have gotten there much faster even if they had to miss two feeder buses and three NEL trains?
A similar phenomenon can be observed with the Novena CDS routes, where 680 and 682 (the ones that stop at Novena first before heading to Orchard) enjoy stronger ridership than 681 and 683, whose downtown route runs the other way in the morning. Commuters headed to Novena are likely to find the first two routes more useful, particularly for workers in the healthcare sector whose start work timings align with earlier CDS arrival timings.
But just because the downtown destinations are arranged in sequential order strong ridership is guaranteed. The City Direct services generally have avoided overindulgent stop counts in the downtown area, largely as a result of their planning to cater to a very niche sector of white-collar downtown office workers. On the other hand however, there’s bus 174e, whose 18 stops between Napier MRT and Kampong Bahru Terminal fail to translate to significant ridership gains from catchment in the Chinatown and Outram areas — 3 in 5 passengers riding 174e through the express sector alight in the Orchard area anyway. On the two variants of express services studied, similar results are observed, with 53% of riders on 502A alighting at Orchard and 60% of 518A riders alighting at Novena. People value the speed brought about the express sectors on these express bus services, but to have to sit through the slowness of a normal bus ride turns many potential riders off from using them. Which perfectly segues into the next bit concerning the City Directs themselves.
(I’m not even going to start on the impact of using “OTA” timetable-based regulation to manage peak expresses on bus speeds and ridership, as compared to the “EWT” headway-based system in place on regular routes. Every bus enthusiast has probably ranted about this to death, and serious reforms are needed, as this is a variable independent of the express route profile)
The five-stop rule
Those who grew up reading Skyscraper City forums gossiping about the unheard side of MRT planning history might have heard of a so-called “nine station rule” where MRT train depots were placed at the 9th station along the line from the boundaries of downtown Singapore, at least where older lines were concerned. Similarly, I want to introduce the concept of a “five-stop rule” observed on City Direct ridership, where ridership only picks up on the last five stops along the residential sector, no matter how many additional stops are placed along the line before that.
On the assumption of a bus spending roughly thirty seconds per stop and the relatively high probability of being caught by a red light, as well as the generally higher traffic encountered on residential roads in the morning, a reasonably estimate of travel time per additional stop is roughly two minutes. Boarding five stops before the express sector would mean a travel time of no less than ten minutes before entering the express sector, and for time-conscious commuters can constitute the upper limit of what’s tolerable before riding the bus becomes too slow compared to the more crowded train option.
Here’s a random selection of three CDS services’ ridership heatmaps, namely 653, 660M and 681. (I used the name picker wheel for this…) Once again, columns from left to right denote boarding bus stops, while rows from top to bottom denote alighting bus stops, and the black box denotes the express sector.
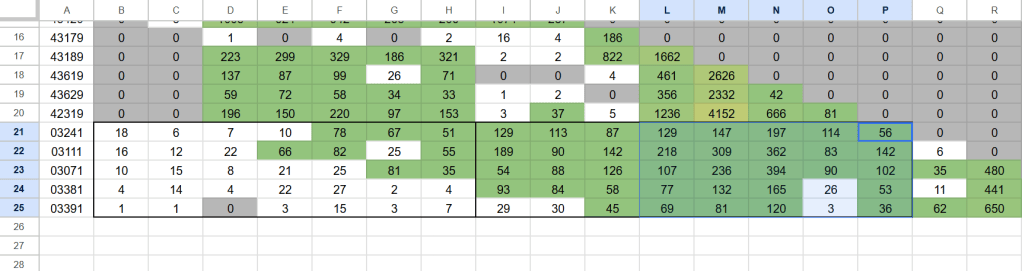
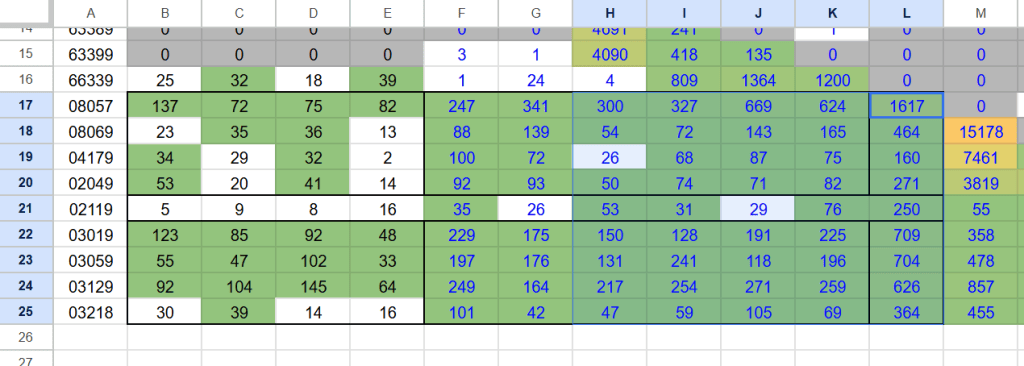
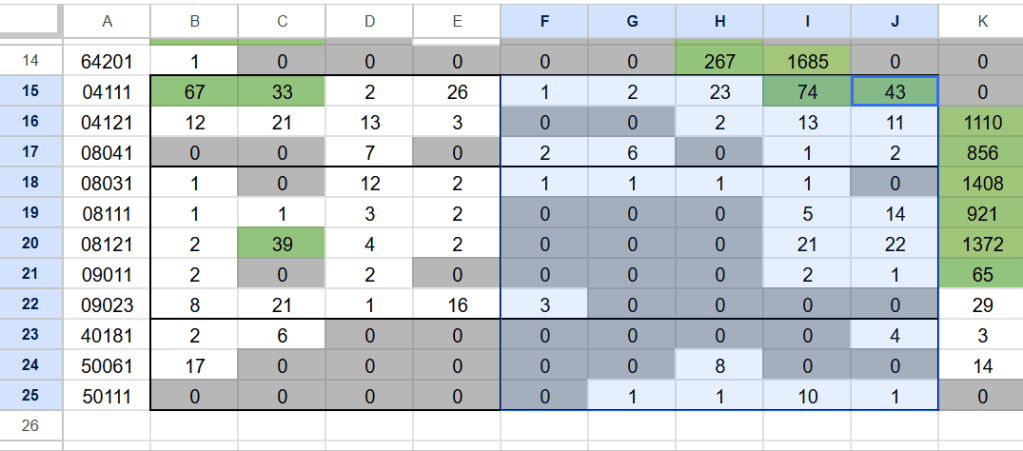
Across the board the pattern is consistent: excepting areas where public transport connectivity just flat out sucks in general (case in point: Upper Serangoon Crescent, the starting point of CDS 681 seen above), ridership trends across the residential sector can be modelled roughly by an exponential trend, with the last five stops contributing the bulk of all ridership through the express sector.
A similar trend can be observed at the downtown end of the CDS routes as well, though to a slightly lesser extent: the majority of passengers alight at the first few stops immediately after the express sector, although this is determined more by employment location than fixed distance rules. Tolerance for riding CDS routes all the way to the end, through multiple stops in the CBD area (an equally time-consuming endeavour as boarding from the start of most CDS routes in residential areas) also increases the later passengers board. Easy and intuitive stuff, if we remember the majority audience of these CDS routes are time-conscious white-collar workers employed by the CBD’s financial sector.
Another important point to note, particularly for certain legacy CDS routes: their routes were designed based on the state of the (rail) network circa 2014, and much has happened since then. While we’re all familiar with the withdrawals of CDS 658, 659 and 662 in tandem with the Downtown Line’s completion by 2017, less well-known is that rail expansion continues to affect other CDS routes too. CDS 652, originally intended to serve the Sembawang Hills, Lentor and Kebun Baru estates, has had its ridership in these areas almost completely wiped out by TEL since its third stage opened in 2022. CDS 653, designed with a unique starting point to serve the Hume and Hillview private estates, is now overwhelmingly patronised by Bukit Batok residents instead, with the former now given the option to take the Downtown Line from the new Hume station opened February 2025. It is probably time to relook how the City Directs function in these areas.
The politically-driven background of the BCEP motivates planners to introduce CDS routes that serve many stops in the heartland areas to hit KPIs related to catchment population. Truth however, as shown by commuters voting with their feet, is that no matter how many stops are added, only the last few matter in achieving the intended outcomes these new CDS routes set out to do. And as mentioned above, only the first few stops in the city are what really matters, in the case of legacy variant expresses.
Pack it up
There must be some mathematical voodoo at work behind determining the fate of the legacy variant express services, because there is simply no way they can get away with such abysmally low ridership and somehow evade LTA’s radar back when bus rationalisation was all the hype. Here are all the surveyed routes with fewer than 1,500 monthly riders in April, or 75 passengers per day:
(Data for 97e is inaccurate as it excludes the new extension to Tengah)
174e 1,324 / 66
680 1,186 / 59
673 1,102 / 55
14e 964 / 48
683 846 / 42
196e 760 / 38
97e 679 / 34*
681 605 / 30
502A 393 / 20
518A 355 / 18
It’s worth noting that excepting the worst-performing members of the BCEP City Direct family (who have the excuse of novelty and the passenger familiarisation phase to fall back upon), the bottom of the barrel is entirely stacked by these legacy variant express services which have been around for around 20 years, and whose ridership is on the downward trend in recent years.
The trend becomes even clearer when we examine ridership by per bus loading, with all routes that carry fewer than 20 passengers per bus on average listed below:
30e 17.6
681 15.0
174e 13.2
14e 12.1
196e 9.5
518A 8.9
502A 6.7
97e 5.7*
Less 681, every route here existed before 2010. It’s a wonder how LTA spent so much effort back in the day to convince people that major trunk routes such as 66, 167 and 506 were unnecessary and useless, all while ignoring blatantly empty buses being shunted around every peak hour. For crying out loud, the aforementioned rationalised bus routes carried more people per bus than an entire day’s worth of passengers on 502A and 518A!
But why? A look at these routes reveals where the original Fast Forwards (the variant expresses with a lowercase “e” by SBS Transit) fell short — the inclusion of too many stops along the heartland sectors, almost to the extent of it being no more “express” than its parent variant. To that end, our suspicion is that the per bus loading reflected for the “e” suffix former Fast Forwards is an indicator for ridership on the parent route, with commuters tending towards treating these express services as merely extra trips of the parent. That also means that these “express” variants are not attracting ridership by virtue of their express sector, and whatever ridership they get is merely diluted from the pool of people who take the local parent services. That’s not to say this is entirely a bad thing — it can further reduce crowding on the parent route on top of peak-only split shift buses deployed, although this benefit may be eroding with the express fare surcharge raised from 60 cents to $1 last year.
14e for instance, is no different from the local 14 across the full length of East Coast Road, serving all stops save a truncated sector in the Bedok South area.
In the case of 174e, the effect is even more pronounced despite more non-stop sectors incorporated in the design of the route. The Fast Forwards were perhaps the imperfect attempt by SBST at “limited-stop” or “rapid” services, that continued to maintain consistent coverage across the route but with longer average stop spacings through the long express sectors between brief local segments. The local segments however, add sufficient runtime to turn prospective riders away from utilising these routes fully, with higher reported ridership between the three heartland sectors than the total ridership into the city. Of all ridership boarding 174e from the Jurong West area, 66.9 people per day alight at Bukit Batok, while another 13.5 alights at Beauty World. Only 11.1 daily riders take it all the way into anywhere in the city, with nearly a supermajority alighting at Orchard. Only one person per day rides 174e across the full length of its route.
With the bottom of the barrel dominated by the ex-Fast Forward series, it’s time to rethink them. Notwithstanding the impact of new rail lines such as CCL6 and TEL4 drawing passengers away, the old model of “local sectors intertwined with nonstop sectors” is no longer effective in building ridership, with patronage barely maintained by inertia from long-formed habits of commuters who have already used them for many years. It also doesn’t help that many ex-Fast Forwards do not use expressways for non-stop sectors, which subjects them to the same traffic light delays that their parent variants are affected by. It’s hard to provide a significant travel time benefit to retain passengers with such a set-up, to say the least. Fewer stops, and allowing buses to “beat red lights”, is the way to go if we do not want to entirely consign faster bus service to become exclusively point-to-point, which the newer City Directs demonstrate to be relatively terrible uses of highly limited bus resources during the peak hours.
Of course, this is in line with earlier reported observations of express services only being most effective around the stops immediately next to the express sector as well.

(that is, in fact a heading)
Beyond the immediate nitpicking at the route design of this round’s City Direct services, there’s a bigger trend emerging from the ridership data once you zoom out, which should inform public transport planning overall. That of course, extends beyond just the City Direct network, or the related network of express bus services. In fact, this even extends beyond the realm of managing our bus resources, all the way into planning for the future of our rail network.
Let’s take a look at the numbers again.
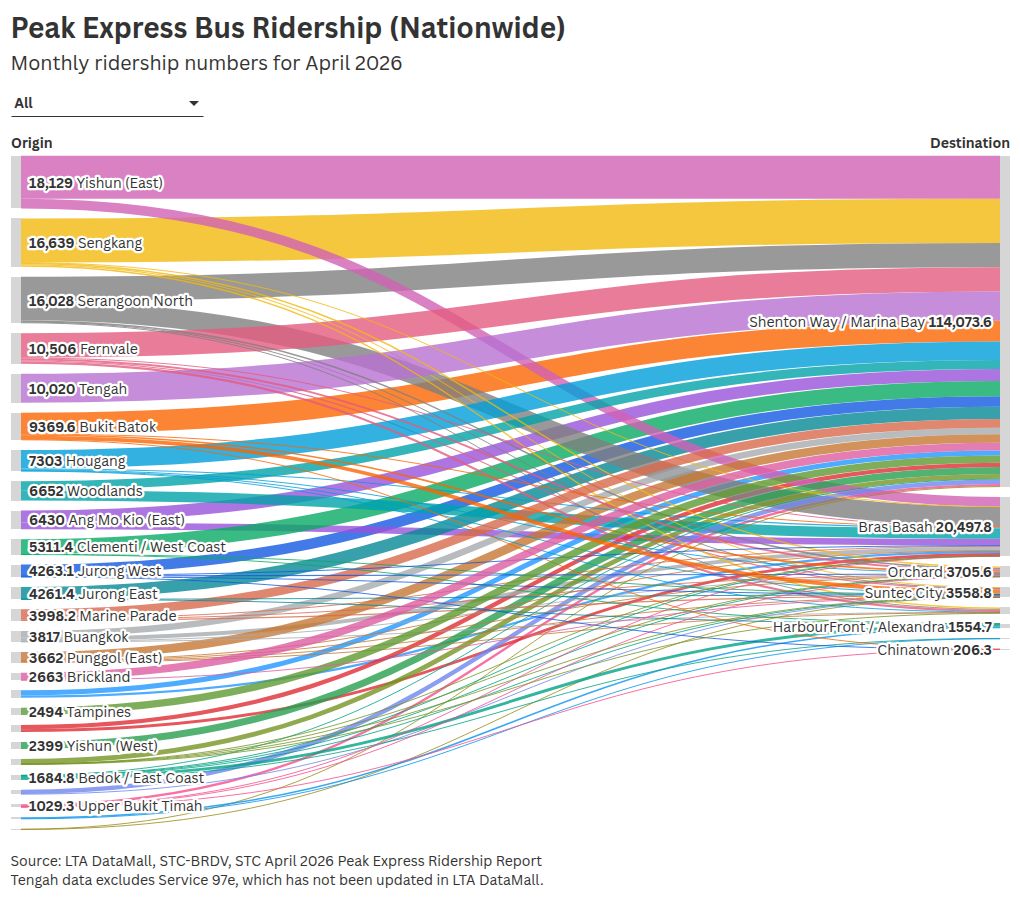
The chart toppers for City Direct ridership (broken down by region) are no coincidence, and should come as no surprise to those who frequent the various public transport options in these areas during peak hour. In sequence, they paint an image of where enhancements to the rail network are most urgently needed. Using a direct point-to-point method of data collection, for all its faults on distorting data visibility in planning the overall network, serves as a clear indicator for where ridership originates for each CDS, where the assumed journey pattern is towards the city.
In sequence, eastern Yishun, Sengkang, Fernvale and Serangoon North topped the list, each registering more than 10,000 monthly riders (which translates to more than 500 riders per day per region). Tengah and Bukit Batok follow closely behind, also hovering around the 10,000 mark. Do note that as data for Service 97e was incomplete at the time of collection, the figure for Tengah is highly likely to be underreported given the reported success of extending bus services 97/e to Tengah in March. Do these locations ring a bell?
It’s also impressive how the Tengah extension has so drastically turned around the fortunes of service 97e — ground observations would tell you this route is now carrying lots of passengers per bus, in contrast to the reported figures that align more closely with its ridership pre-extension. By those numbers, 97e is the worst performing service per trip! That, combined with the extreme loading 674 alone shoulders, is a clear indicator that a growing Tengah town demands better connectivity than just two peak-only express buses alone.
Also notable is eastern Ang Mo Kio, which registers 6,430 monthly riders (322 per day) despite being only served by six trips per day, resulting in one of the highest passenger loading densities for a given region. The general idea remains the same: the area bounded by the North-South and North-East MRT lines remains the prime hotspot for CDS ridership, due to ever-increasing crowding on both lines that squeeze residents of available public transport options to enter the city.
It may be tempting to attribute the success of CDSes in these areas to the positive virtues of the buses themselves, and it certainly helps that these areas are also located close to major expressways that make them a compelling travel option. What is also true is that CDS is enjoying strong success despite the factors that dent ridership elsewhere — windy routes, excessive journey time. While there’ll always be a crowd preferring buses to trains for various quantitative reasons such as comfort and seating, the majority of morning peak commuters — which also form the basis of this survey — are more likely to consider travel time factors, where express bus services also struggle to maintain a competitive edge in. Like with the previous post discussing the Tai Seng peak expresses, the strong reception to CDS routes in these areas reflects either an inadequacy of feeder transport in these areas, or a situation where crowding on the MRT lines has genuinely reached a hellish level that would even push rail-inclined commuters away. The former situation is unlikely, save perhaps in Sengkang and Tengah.
By now the situation should be clear, and if it isn’t, here it is spelt out for you:
Building the Seletar and Holland (Tengah) lines is not anymore an indulgence, but an absolute necessity.
The SLL and HLL are not projects built for tomorrow’s vision. They are urgent tasks built to resolve the needs of today.
Where CDS ridership is highest as noted in the report perfectly coincides with the areas of general alignment undertaken by the Seletar and Holland (Tengah) MRT lines, all currently still in the “under study” phase in LTA. There is, and will continue to remain disagreement on the exact specific choice of alignment, interchange points and so on. But time cannot be wasted any more on dilly-dallying with these utterly crucial rail projects. We must find ways to build these important relief links faster so as to reduce the burden on the three oldest six-car MRT lines. In particular, the NEL is entering the severely aged phase of its constituent components, with asset renewals lined up for the next decade with no Plan B for up to a million residents in northeastern Singapore. Dark times lie ahead if the SLL and HLL do not get built soon enough.
According to Minister Sun Xueling in a 2025 parliamentary reply, the official timeframe for the Seletar Line is “in phases (emphasis mine) starting from the 2040s”. That’s about 20 years from now. If you look at this another way, that means the present is further away from the full completion of the SLL than the day the NEL first opened to the public (20th June 2003). How many more CDS routes, many of which are potentially massive flops, must be launched to tide the northeast until then? Would launching 20 be enough to stave off the Normandy-level crowds? How about 30, or even 40?
We must act faster. The Seletar and Holland Lines must be ready before 2040. As mentioned last year, the SLL and HLL are missed assignments whose consequences are beginning to catch up to us. Kicking the can down the road even further as we have been doing since the early 2000s is no longer a viable approach. That’s why STC’s Transport Manifesto 2050 aims higher: for the HLL to begin running from 2034, and for SLL to begin running from 2035, assuming a construction start date of mid-2028.
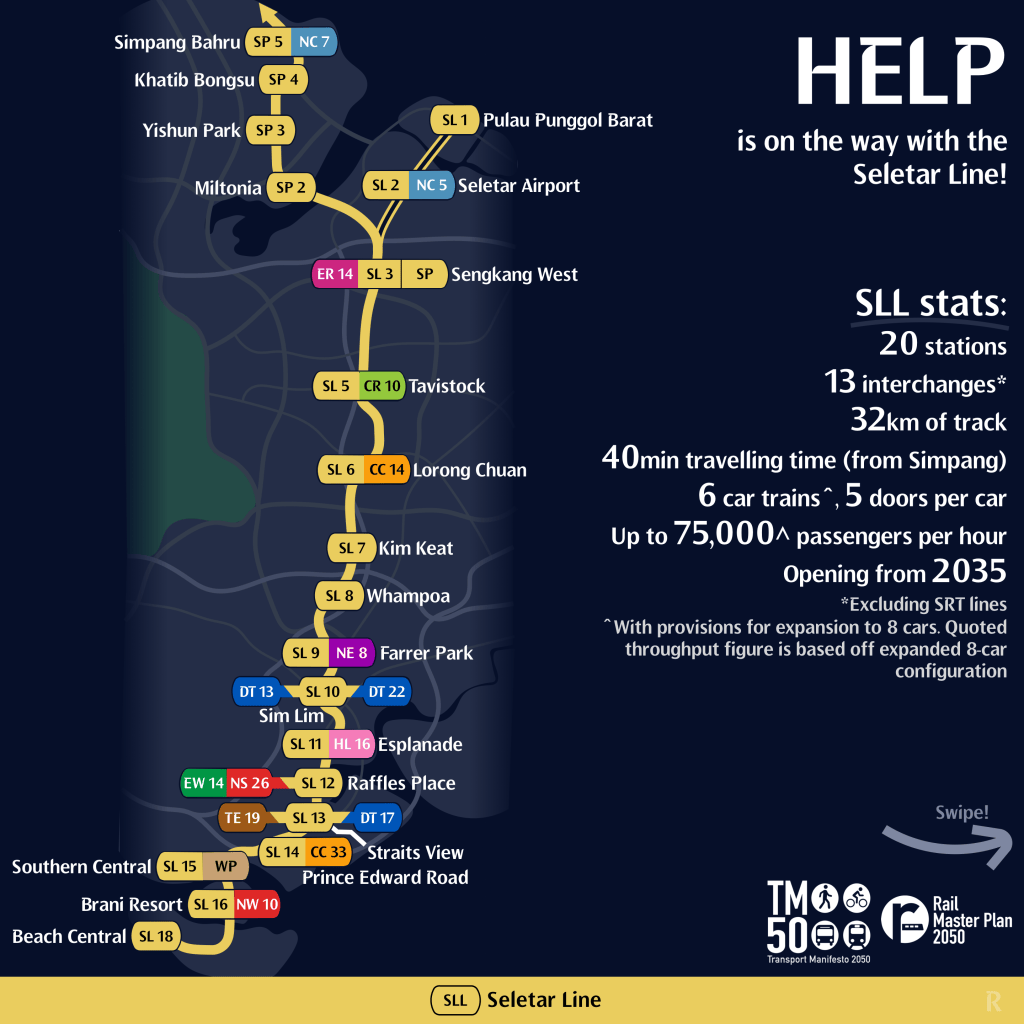
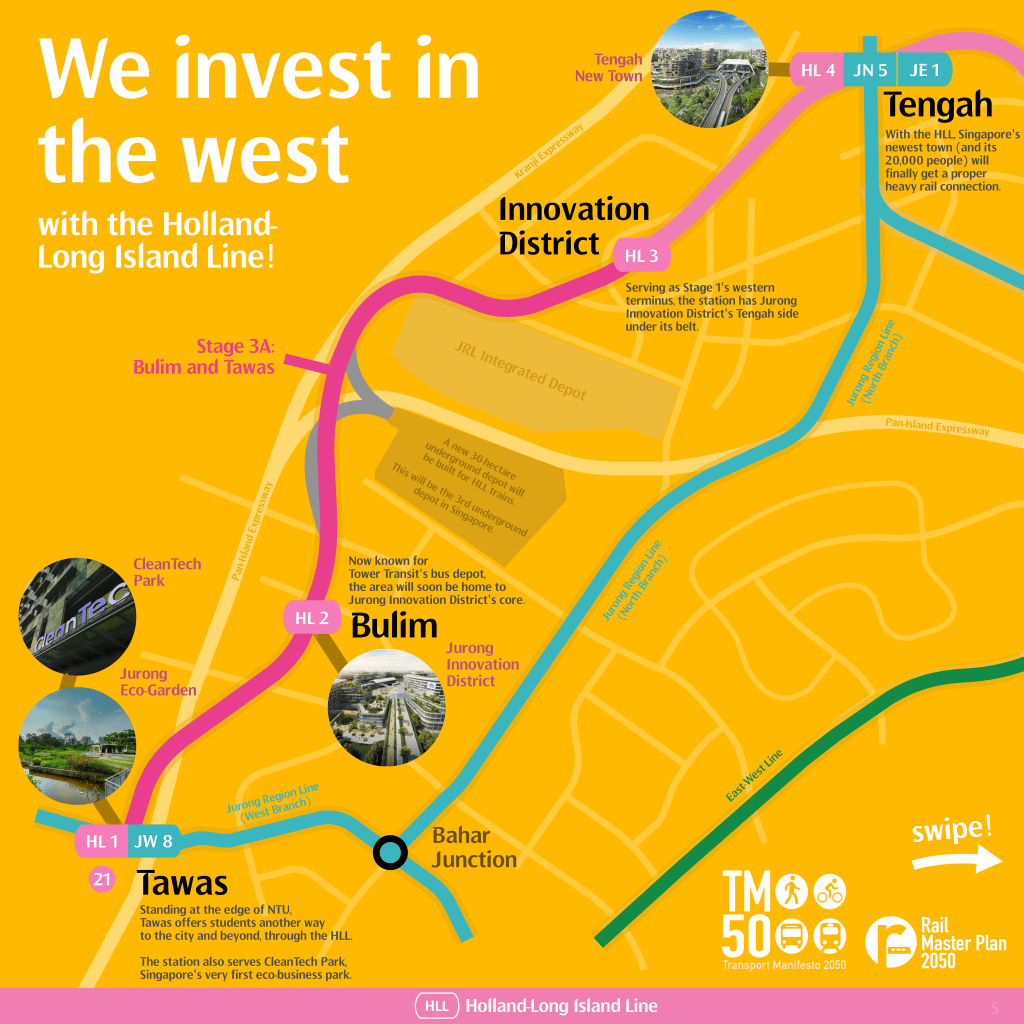
Based on the numbers cited from origin points of morning CDS ridership today, 51,093 monthly trips lie within the catchment zone of our Seletar Line, with an additional 20,456 outside its immediate range that also stand to benefit. 19,390 monthly trips are served directly by our HLL’s alignment, with an additional 16,498 in the wider periphery area, too. For the SLL, that’s 3,800 potential daily riders from buses alone, and 1,800 potential daily riders for the HLL. Enough to contribute a sizeable portion of ridership to sustainably support these new lines, especially after considering the torrent of passengers swarming in from the currently-overcrowded NSL, EWL and NEL. The business case for building these lines has always been there, and today the ridership data also speaks for the absolute need to have these lines built. What’s lacking has always been the will to get these important projects done sooner, and it has held us back elsewhere in the growth of our rail network too.
It’s not just about getting the alignments right this time either. Less the big debates on their specific downtown alignments, ways need to be sought to bring forward the opening date of these critical relief lines as soon as possible. Could we build future MRT lines with an elevated profile, as it takes far less time to sink foundation piles for viaducts than to bore tunnels underground? Standardise station designs and parts, so less time (and money, or manpower) is spent trying to custom-build individual stations to match their surroundings? Perhaps the alignment, especially of the SLL and HLL with utmost priority, could be routed in a way that ensures minimal potential obstruction, both in space and time? (That’s why the TM50 Seletar Line is routed past Tavistock instead of Serangoon North — it would be a project-ending nightmare to attempt tearing open the housing estate for the SLL station box!) A lot can be done, and it’s now the turn of LTA’s planners and engineers to play ball. Perhaps the urgency of building these new lines is also already recognised internally. The question they have to answer is how their conception can be further expedited.
To close off, and describe what the entire CDS planning mentality resembles in the present day and age, here’s a hilarious and iconic quote from the STC community which perfectly fits the BCEP planning mentality:
yeah bc my grandma works at marina bay, my dad shits at suntec, my baby sister eats at orchard, i study at shenton way, and all of my neighbours go to mbs every day for work
cos EVERY ONE WORKS/LIVES/BREATHES/SHITS IN THE CBD!!!! YAYYYYY
Let’s wish for some sanity between now and the next time we study the ridership of these peak express bus services again…
Interested in building a better future for Singapore’s transport? Join the STC community on Discord today!


Leave a Reply