
I’m surprised more aren’t aware of this basic fact in fleet management, and even self-proclaimed “seasoned” individuals in the field of transport planning can find themselves clueless or outright misinformed in this area sometimes.
- What the triangle means
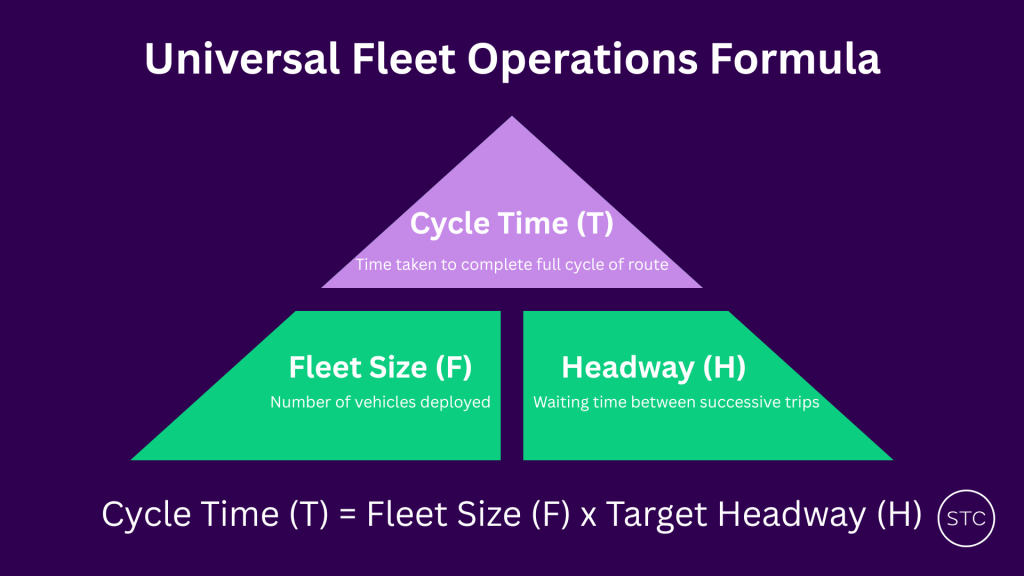
In the field of public transportation, as long as regularly scheduled fixed routes are concerned, the operational variables of fleet size, travelling time, and service frequency will be governed by a single formula:
Those who remember their primary school math will find this similar to another triangular formula they’ve learnt in a long-gone past: the one governing the relationship between distance, speed and time, with distance being the product of speed and time:
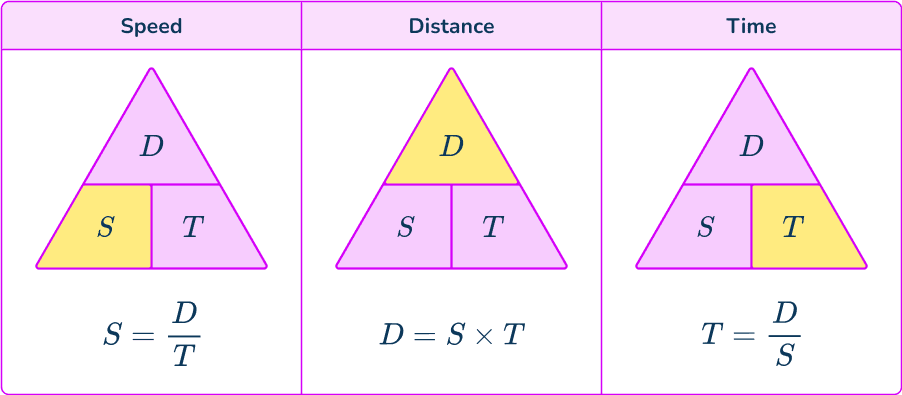
If this isn’t already obvious too, this equation is also what gives rise to the expression of speed units in terms of distance per unit time, such as km/h, or m/s.
Back in the field of transport planning, the single most-used formula when planning daily operations (be it in bus or rail), when translated to plain human speak, is that the total cycle time of a given route is the product of target service frequency and fleet size. That’s quite a bit of relatively technical language, so let’s break it down further:
NB: This formula applies for all modes of regularly scheduled public transportation (rail, bus, ferry etc). This also affects airlines to a certain extent too! Hence, I’ll use “vehicles” as a catch-all term to refer to fleet assets operating on public transport routes when discussing the mathematical theory behind this fundamental fleet management formula. Feel free to replace it with your transport mode of choice, if it better helps you understand the concept.
What the triangle means
Cycle time refers to the total time taken to make a full cycle along a route, from one point along the route in a particular direction, back to that specific point again in the same direction. It is the total sum of travelling time in both directions (whether or not the service loops at one end is irrelevant), and all layovers and breaks included in the round journey.
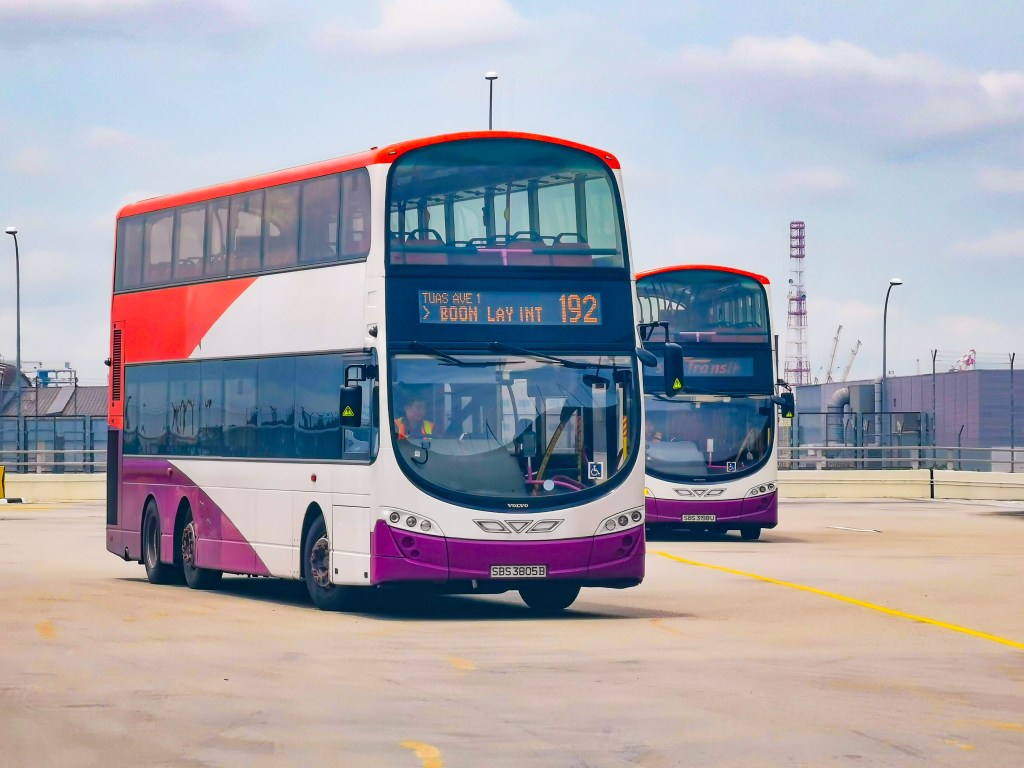
Take for example bus service 67, which spans halfway across Singapore from Choa Chu Kang to Tampines. According to SimplyGo’s bus enquiry page (accessed 16th January 2026), it takes 125 minutes to travel from one end to the other for both directions. Suppose a layover of 15 minutes (standard fare in this industry pending changes in the name of enhancing bus safety) at both termini of the route, this would produce a cycle time of 280 minutes (or 4 hours, 40 minutes). Simple math: 125 + 125 + 15 + 15 = 280. If that’s a little too technical to digest, the cycle time of 280 minutes is defined by how long it takes for a bus to next depart Choa Chu Kang after its previous departure.
For routes that loop at one end, the logic remains the same, albeit with a slight twist: cycle time is defined as the time between consecutive passes at the same point along the route in the same direction. However, this is calculated for loop services simply by adding full-journey travel time together with the layover at the origin end of the route, as turnaround time at the loop end is given to be zero (exceptions exist, although these would either classify the route as de facto bidirectional, or be factored into the total travel time itself), and the journey time already encompasses travel in both directions.
The famous service 858 originating from Woodlands and looping at Changi Airport for instance, has a stated travelling time of 163 minutes according to the same SimplyGo website from above. Given a break of about 22 minutes given at Woodlands (due to the route’s longer nature), this would mean a theoretical cycle time of 185 minutes (that’s 3 hours, 5 minutes)
It should be noted that cycle time should be distinguished from runtime, which is another commonly-cited figure in the field of scheduling public transport. Runtime is defined as just the scheduled travel time from one end of the route to the other, and in the case of looping services, the scheduled travel time for the full trip back to the origin terminus. Cycle time on the other hand encompasses all scheduled layovers, and is specifically defined to include the full round journey, regardless of the nature of the route itself. A simple comparison is shown in the table below:
| Runtime | Cycle time | |
| Service 67 (Choa Chu Kang – Tampines) Bidirectional | 125 minutes (2h05) | 125 + 125 + 15 + 15 = 280 minutes (4h40) (15 min layover at each end) |
| Service 858 (Woodlands – loop at Changi Airport) Loop service | 163 minutes (2h43) | 163 + 22 = 185 minutes (3h05) (22 min layover at Woodlands) |
Fleet size is the number of vehicles required to operate a particular public transport route at a certain target frequency (we’ll get to this in a bit). In actual operations, this is usually the dependent variable being modified by operators to meet headway goals, and is also simultaneously the limiting factor of regular scheduled transit operations. Depending on how the scope of operations is defined, this can refer to the fleet size needed for a specific service pattern (in systems that operate multiple patterns eg: local/express trains, bus routes with short trips/downroutes) or the overall fleet size needed. Having to account for this slightly complicates some things, but we’ll also get there later.
There’s a twist to this variable as well: most services still require the presence of a human driver on board to operate the vehicle, which adds an extra limiting factor to how much service is realistically available within immediate reach. If a service requires the use of vehicles that must be manually driven and/or crewed, the real fleet limitation may not be the number of vehicles present, but also the number of drivers / crews available to operate these vehicles.
Perhaps the most well-felt aspect of this equation is target frequency, which governs waiting time (the rider’s least favourite bit of the journey). This variable cannot be directly controlled by PTOs — rather, it’s a service quality goal that has to be met through manipulating the route’s cycle time and allocated fleet size. The ideal practice is to set the desired target headway first, before manipulating the other two variables based on available resources on hand. Because reality isn’t kind to most public transport operators in the world however (Singapore included), what often happens is that compromises to frequency are made to accommodate limitations in fleet size available, due to an inability to fully compress cycle time.
Let’s say you have a route with a cycle time of 80 minutes, after factoring in everything (terminal layover, dwell time at intermediate stops, potential delays etc.) If the target headway is 8 minutes, you’d need to have 10 vehicles on hand (80 / 8 = 10). Suppose your fleet only has 8 vehicles available for this route. To run the desired 8-minute target frequency, you’d either need to:
- find a way to compress the cycle time from 80 to 64 minutes;
- somehow cough up an additional 2 vehicles (and usually that also means 2-4 extra drivers!) to maintain the current 80 minute cycle time;
- or, accept the inevitable and drop frequency to 10 minutes.
Or, some mix of all the above three choices, especially if the difference between expectation and reality is larger.
In the real world, most operators with limited policy tools available within immediate reach opt for the last option. In Singapore for instance, a bus driver shortage since the pandemic has led to bus operators cutting back service levels to match their remaining manpower pool available.
To recap on the fundamental fleet management formula: cycle time is the product of fleet size and target frequency.
But life isn’t so simple?
The above-given formula is the basic building block of understanding the relationship between available resources, route design and the resultant service quality that can be offered. There’s a small complication to it that arises from real-life public transport services operating more complicated service patterns, either involving partial trips or different stopping patterns.
Short trips (which include both short-working trips and downroutes in the context of discussing resource management) that share the same stopping pattern with the main route are slightly easier to work with, where two possible ways exist to express the given formula. Let’s take the example of bus services 43 and 43M (which used to exist before October 2025).
(For those unaware: 43 plies Punggol – Serangoon – Upp East Coast, while 43M was a bidirectional short trip between Punggol and Serangoon only. The latter has since been withdrawn and replaced with service 104 under the BCEP)
| 43 (Punggol – Serangoon – Upp East Coast) Bidirectional | 43M (Punggol – Serangoon) Loop* | |
| Runtime | 95 min | 70 min loop –> 35 min unidirectional |
| Cycle time | 224 min (est.) 10 min layover at Punggol, 24 min layover at UEC | 80 min (est.) 10 min layover at Punggol |
| Peak frequency | 8 minutes^ | 10 minutes |
| Fleet size (derived) | 28^ | 8 |
^Actual value is 22 because selected trips only perform 1-way journeys during peak hours (i.e. peak frequency only applies in 1 direction)
Two possible ways exist to calculate resource requirement for routes involving short trips that could potentially operate at different headway from the parent service (ie they might not run as perfect alternate departures of the parent, for instance the EWL’s 2:1 split between Joo Koon short trips and Tuas-bound full trips). The first (and more cumbersome method) is to calculate the “cycle time” for each line sector, and through determining the average combined headway through each sector, perform sector-wise resource requirement calculation using the formula before summing the number of vehicles needed across all sectors to give the total resource requirement.
The second, and simpler (as well as more versatile, as this method can also be used to calculate resource requirements in situations where the average speed of service variants differ, such as in the case of railway lines with both express and local services — the sector-wise method above cannot be used to calculate required fleet for such situations) method would simply be to separately calculate the fleet size required for each variant of the route, before combining them together to obtain the full required fleet size.
Method 1: Sector-wise
Partial cycle time between Punggol and Serangoon: 10 + 35 x 2 = 80 minutes
Partial cycle time between Serangoon and Upper East Coast: 24 + 60 x 2 = 144 minutes
Throughput between Punggol and Serangoon: 60 / 8 (svc43) + 60 / 10 (sv43M) = 13.5 buses per hour
Throughput between Serangoon and Upper East Coast: 60 / 8 = 7.5 buses per hour
Average headway between Punggol and Serangoon: 60 / 13.5 = 4.44 min
Average headway between Serangoon and Upper East Coast: 8 min
(I’ll explain in a bit why this part is highlighted)
Fleet requirement between Punggol and Serangoon: 80 / 4.44 = 18 buses
Fleet requirement between Serangoon and Upper East Coast: 144 / 8 = 18 buses
Total fleet for service 43/M: 36 buses
Method 2: Variant-wise
Cycle time of service 43: 224 minutes
Cycle time of service 43M: 80 minutes
Average headway of service 43: 8 minutes
Average headway of service 43M: 10 minutes
Fleet requirement for service 43: 224 / 8 = 28 buses
Fleet requirement for service 43M: 80 / 10 = 8 buses
Total fleet for service 43/M: 36 buses
But I waited 20 minutes for the bus!
Notice that in the sector-wise method, I’ve highlighted the bit involving calculation of average headway, and some might question why a seemingly roundabout approach was used. Why couldn’t I have just averaged out the headways of both constituent route variants and divided by 2 to obtain the average?
This is where the concepts of throughput and combined average headway come in very significantly. It can be tempting to use one-off cases of wildly irregular observed headway to dismiss the theoretical (scheduled) frequency in discussions surrounding how frequent a service exactly is. These perceptions are distorted further because in situations of bunching, more people statistically encounter the much longer wait rather than the shorter waits caused by irregular headways, and is particularly true for buses in Singapore, which largely continue to lack bus priority across the board. Operationally, a 19 minute wait followed by two buses 1 minute apart is the same as two buses spaced apart at 10-minute intervals, because both provide two buses in a 20-minute span. Likewise, actual average frequency between different service variants is determined by the dividing by the sum of all trips across the hour.
Maybe this isn’t as obvious with frequency differences down to individual minutes, but it gets apparent when the intervals get wider. What’s the average frequency between two services, one every 10 minutes and the other every 30? It’s not 10 minutes (20 divided by 2), but rather 7.5 minutes, as the former offers 6 trips per hour and the latter offers another 2. Combined, that’s 8 trips per hour, giving a 7.5 minute average headway. It doesn’t actually matter if the vehicles are spaced exactly equally apart — 8 trips per hour means a theoretical average frequency of 7.5 minutes, even if all 8 of them were to arrive together after an hour-long wait!
A one-way disclaimer
In some cases (typically for buses), particularly for services that may be peak-oriented in one direction, the operator may choose to run some (or all!) vehicles in a single direction only, before deadheading them back to the other end to start another trip in the same direction again. A well-known example is SMRT’s famously crowded bus 190, where some buses immediately deadhead back to their starting point in the same direction to begin the next trip. Other examples may include short-trips (bus numbers with suffixes A B C etc, eg 55B) or downroutes that operate in a one-way cycle. Note that these cases are considered separate route variants, because their cycle time differs from the main route, and should not be calculated as part of the baseline fleet size. In the case of service 43 described above, the actual peak fleet usage is 22 (according to SGWiki) instead of 28 because selected buses only operate in one direction during peak hours.
Applying the triangle
This is the part that’s more interesting — how exactly does the triangle translate into various actions that can be taken to enhance our public transport journeys?
Manipulating cycle time
Most strategies in improving public transport typically involve manipulating various aspects of cycle time, especially where hands are tied in terms of fleet size and frequency being a service target to meet.
To be fair, these strategies all already exist out there in the real world, either in Singapore or elsewhere (if not implemented in Singaproe yet). What’s important here is to note how all of these service enhancement strategies eventually tie back to the same fundamental fleet formula expressed above. That’s why this triangle equation is “magical”!
Faster is cheaper
The fleet management formula shows just why it is so important that buses and trains be faster. Faster journeys means shorter cycle times (T), and hence fewer buses (F) are needed to operate these services frequently. Alternatively, the same fleet can be used to deliver an even higher frequency (shorter intervals H), further shortening your total travel time (on top of travel time reductions from the faster journey itself!)
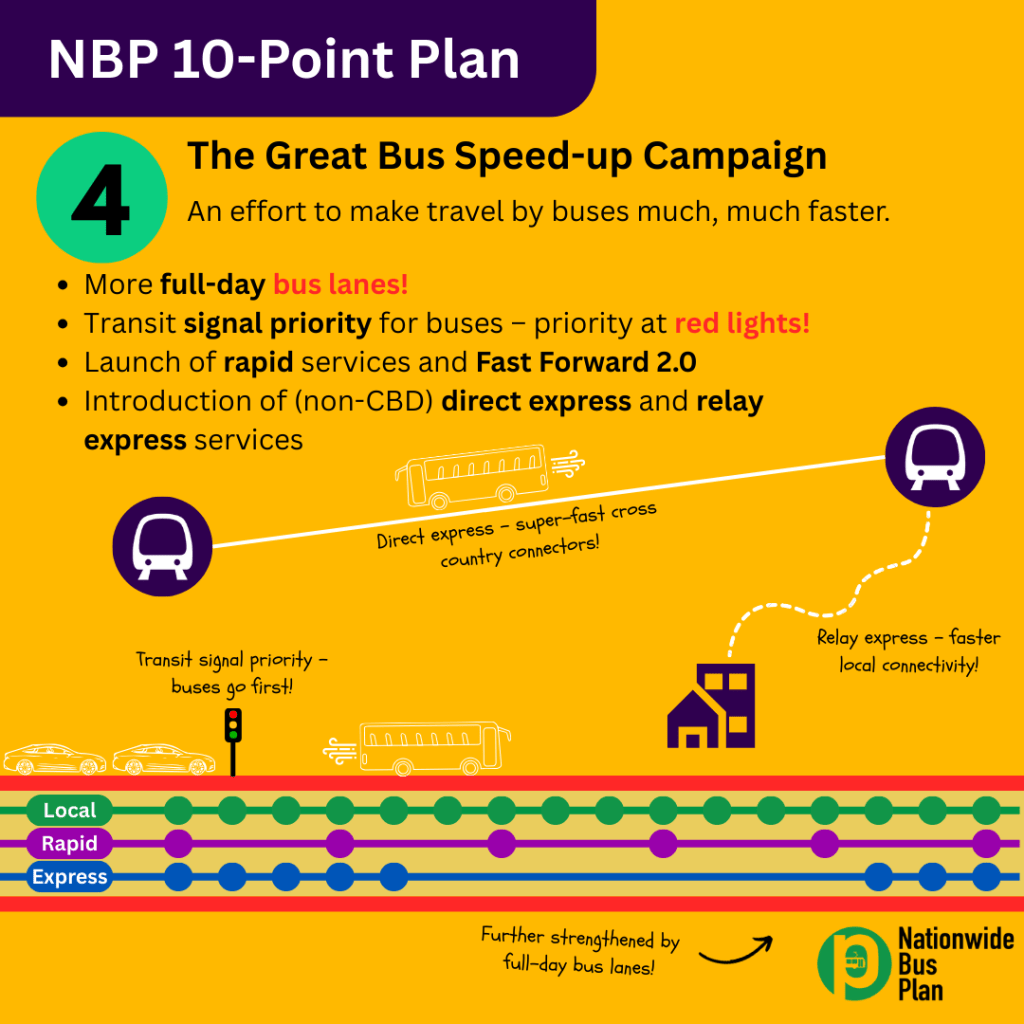
In our Transport Manifesto 2050, this is why we place emphasis on various aspects of speeding up our buses in particular, through the extensive usage of full-day bus-only lanes, signal priority at junctions, and the introduction of rapid-stop bus services (both new routes, and upgrades from existing trunk services). This is so that bus resources can be freed up to either improve other local services needing enhancement, or introduce new routes that enhance access in underserved towns, today and tomorrow.
It also means fewer drivers are needed, which can be a huge lifesaver for bus operators, who are pressed to deliver quality service with immense manpower shortages on hand that never recovered from the impact of the pandemic. Reminder: every bus requires two drivers to operate throughout the day, one for the morning and one for the evening shift, excepting peak-only or overtime duties.
Counterintuitively, despite the higher fares that they charge, faster bus services (rapid, express etc) are actually cheaper to operate for this reason than a corresponding route that calls at every stop, which significantly inflates cycle times. A general increase in average speed across the board already helps to significantly decrease the required fleet size, and that’s before we move into more targeted improvements that further chip away total cycle time. Excepting the immediate coverage tradeoff, shortening cycle times by reducing stop count also benefits riders, who enjoy reduced travel time to their destinations. (The coverage tradeoff is addressed through a combination of faster transport services having a wider walkshed than local options, and enhancing last-mile local connectivity to meet these faster services)
The non-ethical method: Under pressure from severe manpower/fleet shortages, some operators can (and will) resort to excessively tightening runtimes (without reasonable countermeasures, such as removing stops or introducing bus priority) in an attempt to cut cycle time and bring resource utilisation within their available limits. This has been an increasing trend in the local public bus industry since the start of the pandemic, and historically has also been employed during a period where the expectation to self-fund bus operations meant running buses as quickly as possible to use to least number of buses to maintain service levels. Needless to say, especially in the current age, these exploitative practices severely hurt the welfare of bus drivers, especially when they inevitably get delayed and lose their break and meal times as a result. It’s a vicious cycle, really.
Break time? What is that, can eat?
Another common method to reduce total cycle time is to cut layover times at termini. This might apply less to rail operations, but for bus services (and even aircraft!), cutting layover times can help ease fleet and manpower crunches as well, especially if there’s quite a bit to cut to begin with.
The more commonly-seen approach is to entirely remove layover time at one end of the route, either through scheduling immediate departure on arrival (which can be a formal looping arrangement, or a mere backend operational detail). Depending on circumstance, this can also effectively help with parking lot shortages in smaller bus interchanges as well.
In the bus industry, some routes also make use of a practice known as jumpbus (formally termed CLOWbus: Crew Lay Over Without bus), where the driver hands his bus over to the previous driver upon arrival, and the bus can depart immediately on its next trip while the driver rests and waits for the next bus. It’s important to note that while this reduces the number of vehicles needed, jumpbus alone doesn’t impact manpower utilisation. You can think of it as shortening the cycle time for the vehicles, but not the drivers needed to operate them. For a host of other reasons including schedule recovery and service reliability, it’s not advisable to pair jumpbus with other layover-cutting strategies, and the routes that do indeed do this (looking at Sengkang West bus depot, ahem 73 and 102 O.o) are extremely vulnerable to disruptions caused by en-route delays.
The non-ethical method: If bus operators can’t cut runtime because of limitations in the route, the next approach employed is to cut break times to squeeze the fleet further, as layovers usually add up to about 2-3 buses across the total cycle time period. Its impacts on bus drivers are more direct, and past FAFO cases involving unethically cutting break times mean that the preferred approach is squeezing runtime, rather than directly squeezing breaks. (The bus safety report released in 2024 also highlighted the need for minimum break times, which also closes the door to such practices.)
On squatting less
The last area to attack cycle time problems from is dwell time, which is defined as the time spent by a vehicle at a given stop. (The rail industry, for purposes of scheduling and signalling, has a more technically strict definition of dwell time based on movement of the train wheels) It might seem minor compared to the rest, but from the broader operational perspective, time savings from dwell time reduction across dozens of stops on a line can add up to make a noticeable difference in cycle times. I don’t need to say the rest — shorter cycle times, fewer vehicles, higher frequency.
For buses, this is where the concept of all-door boarding becomes extremely valuable. Why can MRT trains board and alight hundreds of passengers within the span of merely 15 seconds, while buses will spend eons at busy bus stops just trying to board only 50 passengers? Contrary to official propaganda, the secret sauce isn’t door count, but the fact that every door can be used for simultaneous boarding and alighting activities, rather than just the front door only. The rail network also collects fares before passengers board (people tap into stations, but tap onto buses), which speeds the process up even further. These are all essential ideas in optimising dwell time that BRT systems worth their salt employ regularly to provide significant dwell time reductions on par with rail rapid transit, and is part of how they make good the “rapid” part of their brand name.
In rail (particularly rapid transit), adjusting dwell times has a much bigger impact on overall cycle times, due to trains running at much higher frequencies than buses. Shaving off a few seconds of dwell time at every station can add up to removing a few trains from the cycle at 2-3 minute headways. These are savings that can be reinvested towards pushing up the capacity of rail lines even more — 7.5 seconds is the difference in headway between 30 trains per hour and 32 trains per hour, and that’s easily an additional 3000 ppdph given 6-car trains carrying 1500 people each. (Whether our rail lines can handle further ridership increases, or should be made to do so, is an entirely different topic altogether, for another day)
Layout matters
As an extension of the previous point on dwell time, the type of vehicles used on a given route, and particularly their interior layouts do contribute towards optimising route performance. Recall from a 2024 article on here that public transport route ridership profiles can take on two different types: cyclical (high exchange throughout the route) and cumulative (long-haul, end-to-end). With dwell times being more significantly impact by high cyclical demand due to bidirectional passenger movement inside the vehicle, things like double-decker buses instead of bendies, adopting transverse seating layouts instead of longitudinal seating can significantly increase dwell time when those occur. I’ve done enough pieces on that before, so feel free to look for it using the search bar on the site. The gist of it is basically this: more standing space = better internal passenger circulation, especially in tandem with all-door boarding to cut dwell times.
Manipulating fleet size
Fewer options exist to enhance service using fleet-based strategies (besides just throwing tons of money to get lots of new buses and trains), but not to say fleet and manpower limitations are hard barriers towards service improvements on public transport.
A matter of timing
Some areas are blessed with staggered ridership timings by demographic — not everyone is attempting to go everywhere at the same time. Smarter operators would identify potential “staggering” in ridership spikes by route and time to create what’s known as “interlining” or “crossover trips”, where vehicles are redeployed from one route to another within the same shift to reallocate resources throughout the day.
Here’s a relatively well-known example in Choa Chu Kang. We’ve all heard of the infamous “Mission Impossible” video about bus 190 that led directly to many service enhancements (5-minute baseline peak frequency, short trip 190A, evening downroutes from YMCA/Somerset, new services 972/M) leading up to DTL2’s opening in 2015, and it’s still very crowded even today despite all of that.
With a fleet size fast approaching 40 buses (among the biggest across all bus services in Singapore, despite being nowhere near the longest), throwing even more buses just at 190 might not be the wisest answer. The thing about the crowds that crush-load 190 (alongside 972/M and the DTL) during peak hours, is that they predominantly consist of working adults who travel between 7.30am and 9am (they follow the 8-to-5 or 9-to-6 working schedule, as is common for white-collar jobs in Singapore).
What SMRT has done instead is to introduce crossover trips from feeder service 302, which has a different “peak” timing from 190 in the mornings. Unlike 190, 302’s main peak crowd in the mornings consist of students who study in the many schools located in Choa Chu Kang and Yew Tee, and in Singapore fashion, they all start well before 7.15am. This perfect staggering of students and adult workers allows for a select group of buses to be deployed on 302 first in the early mornings (before 7am) to meet student demand, before crossing over to 190 in the later morning peak to meet the surging peak load from adult commuters heading towards the city. Many similar interlines like this in Singapore and elsewhere operate on the same principle: to use the same bus as part of the fleet of multiple routes, redeployed between them as necessary where ridership demands. That cuts the fleet needed (technically), while maintaining high service frequency, when it’s needed most.
Bite the bullet
Sometimes, in terms of raw vehicle count, the fleet might appear sufficient, but what’s lacking instead is high-capacity vehicles. Operators are faced with two choices: to either cut service to maintain a full fleet of high-capacity vehicles, or plug the fleet deficiency with lower-capacity vehicles that may create overcrowding and result in people being unable to board. (This assumes the route is constant, where runtime cuts are not possible to mitigate the situation, such as in the case for urban rail lines that typically do not support express services)
In Singapore, this phenomena manifests itself in the ever-increasing appearance of single-deck buses on high-demand routes that otherwise had fully double-deck or bendy fleets in past years, caused in part by improper asset lifespan management resulting in a nationwide shortage of double-decker buses to meet operational requirements on all high-ridership bus routes. Over in Kuala Lumpur, RapidKL continues to deploy 2-car trains on the 4-car Kelana Jaya Line, despite the line reaching maximum capacity during peak periods, simply because there remain insufficient 4-car trains to maintain headways across a 46km line with 37 stations!
(The linked article is from 2019 and is outdated, but the math behind why they do this even today still stands)
54 sets of trains need to run simultaneously to achieve the 3-minute frequency. While the Kelana Jaya line has 64 train sets, only 43 sets are 4-coach while 21 sets are 2-coach.
Here you can see the formula in action. It’s implied that the KJLRT has a total cycle time of 162 minutes. Should only the high-capacity 4-car trains be deployed, the most frequent the line can get is 3 minutes, 46 seconds, or barely shy of 16 trains per hour. A 3-minute headway is 20 trains per hour, and even with the 2-car fleet mixed in during peak operations (assuming equal deployment probability), deploying the mixed fleet at higher frequency increases throughput by 5% compared to sticking entirely with the 4-car fleet only.
(The math: the “average” train length across the whole fleet of 64 is about 3.34 cars, and 20 trains of “3.34 cars” (total 66.9 cars) per hour is still more capacity than just 16 trains of 4 cars (64 cars))
There are merits and downsides to each option, and until asset owners finally muster the ability or courage to commit to a bigger high-capacity fleet, operators have to make hard decisions between two options above, and live it down. Usually, committing to frequency rather than individual vehicle capacity is better at managing high ridership, unless the capacity disparity between different vehicle sizes is extremely significant, at which point it should become very necessary to make procurement of bigger vehicles an urgent immediate priority, for any sensible transport authority.
Shifting the goalpost (Manipulating target headway)
Despite frequency being the service target in operations, it might make sense to re-examine these goals when life gets tough. Maybe the whole line doesn’t need the same very high frequency as desired in service delivery goals, or a specific sector of these very broad routes needs even more service on top of the delivered baseline.
As mentioned above, the target headway portion of the formula can also be interpreted differently, based on the scope in question. When push comes to shove, it may be wiser to focus more resources on a shorter segment of the full route, as it’s less taxing to run high frequency on shorter segments. Simple reminder: shorter cycle time = fewer vehicles needed to maintain frequency.
In the Singapore context, that’s also the logical basis behind lettered-suffix (eg A, B) short trips for buses, additional downroute trips (no suffix, numbered identical to parent route), and “M” modified bidirectional short-trips, such as 43M seen earlier. A later development that emerged with the launch of BCEP was the introduction of “short trip couplets”, where a pair of short trips on the same service are designed to run as a partial variant of the full route that does not originate from either termini of the main route. Three notable examples exist, namely 39A/B (Jalan Kayu/Punggol – Pasir Ris MRT), 86A/B (Yio Chu Kang MRT – Jalan Kayu) and 129A/B (Temasek Polytechnic – Bartley MRT).
This happens on the rail network too — the most well-known example being the practice of turning back most EWL trains at Joo Koon instead of sending them all to Tuas Link. It saves for the need to run too many trains into the emptier Tuas West Extension, albeit at the cost of the bus being a faster option between Tuas Link and Joo Koon, when holistic travel time is considered.
Fundamentally, short trips / downroutes all point towards an advanced form of headway management that considers frequency targets by individual sectors rather than the entire route itself. It gives operators more granular control over resource utilisation where it’s most needed across major trunk corridors, and because bus priority in Singapore is nonexistent, applying them on bus services is also a good safeguard against runaway bus bunching caused by traffic congestion enroute.
Let’s go back to the example of bus services 43/M mentioned earlier. As one can probably tell from the presence of the 43M short trip, ridership intensity is higher between Punggol and Serangoon, where it plays a unique role in linking Buangkok Green and Serangoon North to Serangoon MRT on the NEL and CCL, whilst the remaining section to Upper East Coast overlaps many other bus services (along the Tai Seng/Upper Paya Lebar corridor, which the upcoming peak expresses 457, 458 and 459 aim to relieve, as well as the corridor between Marine Parade and Upper East Coast) With only 36 buses, it achieves an average headway of 8 minutes (in the peak direction) between Serangoon and Upper East Coast, and an impressive 4 min 27s average headway* between Punggol and Serangoon. The presence of 43M, rather than running the entire fleet throughout the whole route, enabled resources to be concentrated along the unique Punggol – Serangoon sector whilst maintaining single-seat connectivity into Tai Seng, Paya Lebar, Marine Parade and Siglap for others.
*I would personally want to whack whoever was in charge of scheduling 43/M at Go-Ahead all those years, because despite the ability to significantly improve actual headways with the short trip, they always manage to schedule the 43 and 43M buses to depart Punggol together, defeating the purpose of using the short trip to improve waiting time en-route. 4 min 27s, is after all, just the theoretical calculated average headway — the actual experience is probably more similar to waiting 15 minutes for three buses to show up together or something.
This strategy’s effectiveness can be visualised in two ways. Had all 36 buses been placed on the full route between Punggol and Upper East Coast, the peak frequency would have been 6 min 13s (224 / 36), instead of the 4 min 27s observed on the 43M segment. Alternatively, if the high frequency of the 43M sector had to be extended to the full route, there would need to be 50 buses running, instead of just 36. The ability to control headway by segment helps ensure the areas that matter receive the quality of service they need, while keeping within fleet and manpower budgets available on hand. A more extreme case of this is cross-border services 170/X — the parent 170 to Queen St in Rochor is scheduled every 15 minutes, while SBST goes all ham with 170X’s fleet — I doubt that it even has a schedule to go by, the drivers are probably just told to finish as many rounds through the Causeway as they humanly can in their shifts. /j
The next time it’s time for your local bus or train service to get better, always remember the magic trio that determines everything in operations, from fleet to scheduling and your own journey time as a rider:
重要的事情说三遍 (important things said thrice)
cycle time = fleet x target headway
cycle time = fleet x target headway
cycle time = fleet x target headway
The solution to your public transport woes might not come immediately from this equation, but it will inform what needs to be done for your journeys to become less crowded, faster, and make the inevitable part of your day a tad more pleasant. It’s always easy to ask for more buses and trains, but the truly interesting conversations lie in figuring out how they should be arranged to deliver the best service outcomes for the populations that depend on them day in, day out.
At least, I hope nobody after this goes around claiming that faster public transport requires more buses and trains to operate than before! That’s basic math of how public transport operates, and you shouldn’t be getting it wrong! How do we even have conversations on making our transport better when we can’t respect the math governing it?
Interested in building a better future for Singapore’s transport? Join the STC community on Discord today!

Leave a comment